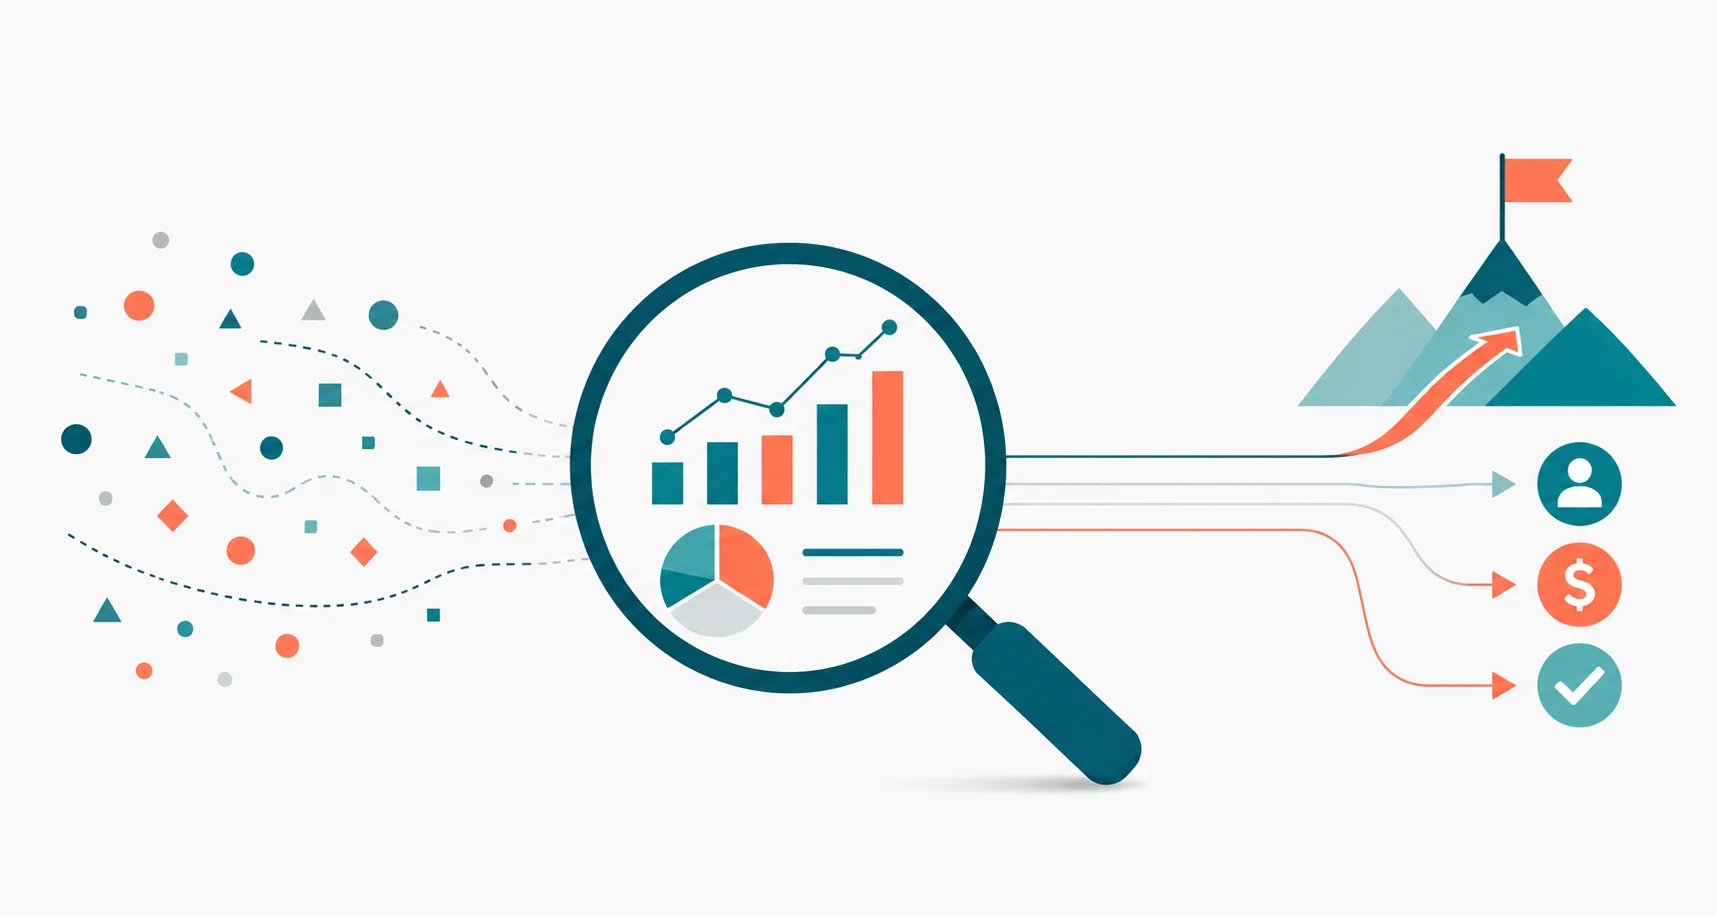

Every business measures something. Revenue. Pipeline. Traffic. Conversion rate. Despite this abundance of information, organizations continue to ask surprisingly simple questions: Why did revenue decline? Why didn't the website redesign improve sales? The problem is rarely the absence of data. The problem is that data, by itself, does not reduce uncertainty. Analytics exists to improve decisions -not to produce reports.
Every business measures something.
Revenue. Pipeline. Website traffic. Conversion rate. Customer acquisition cost.
Collecting data has never been easier. Modern businesses generate information from websites, advertising platforms, CRMs, finance systems, and dozens of other applications.
Despite this abundance, organizations continue to ask surprisingly simple questions.
Why did revenue decline?
Why didn't the website redesign improve sales?
Why are we generating more leads but closing fewer customers?
The problem is rarely the absence of data.
The problem is that data, by itself, does not reduce uncertainty.
For decades, organizations have treated analytics as a reporting function. Reports summarize last month. Dashboards display today's numbers.
Reporting has undeniable value. It creates visibility.
But visibility is not the same as decision support.
This distinction isn't new. When researchers at Carnegie Mellon and MIT Sloan began developing Decision Support Systems in the early 1970s (Gorry & Scott Morton, 1971), they weren't trying to produce better reports. They were addressing a different problem: managers were making increasingly complex decisions that traditional reporting systems couldn't support (Simon, 1947).
The objective shifted from distributing information to improving decisions.
That shift still defines the purpose of analytics today.
Yet somewhere along the way, many organizations began optimizing for the report instead of the decision.
The result is a paradox.
Businesses have never measured more.
Yet many still struggle to answer the only question that matters after reviewing a dashboard.
What should we do next?
This paper argues that analytics was never meant to answer what happened.
Analytics exists to improve the next decision.
Why Do Businesses Measure Anything At All?
The obvious answer is "to understand performance."
A better answer is to reduce uncertainty.
Every meaningful business decision is made with incomplete information.
Should we increase our Google Ads budget?
Should we hire another salesperson?
Should we redesign the website?
None of these decisions can be made with complete certainty.
If they could, management wouldn't exist.
Management exists because uncertainty exists.
Measurement exists for exactly the same reason.
Businesses don't measure revenue because revenue is interesting. They measure revenue because it helps answer questions. Is the business growing? Is the current strategy working?
A product team doesn't measure feature adoption because charts are inherently valuable. It measures adoption because it wants to understand whether customers are finding value.
A sales team doesn't monitor pipeline because pipeline itself is the objective. It monitors pipeline because it influences hiring decisions, forecasting, and resource allocation.
Businesses don't measure because data is available.
They measure because decisions are unavoidable.
The metric is rarely the objective.
The decision is.
Instead of asking -
how much data are we collecting,
a better question is - which business decision does this measurement improve?
If the answer is "none," the measurement may still be interesting.
It just isn't operationally useful.
Why We Measure Proxies Instead of Reality
If businesses could directly measure the things they truly cared about, analytics would be remarkably simple.
But they can't.
No analytics platform can measure trust.
No dashboard can quantify buying intent.
No report can tell you whether a customer genuinely believes your company is the right choice.
These are the factors that shape business outcomes. They're also some of the hardest things to observe directly.
Instead, businesses measure things they believe are closely related.
Website traffic becomes a signal for awareness.
Click-through rate becomes a signal for message relevance.
Lead volume becomes a signal for demand.
Customer satisfaction scores become a signal for customer experience.
None of these metrics are the outcome itself. They are proxy metrics -observable signals that stand in for something far more complex.
This isn't a limitation of analytics. It's a limitation of reality.
Used correctly, proxies are incredibly valuable. They allow organizations to make decisions long before the final business outcome is visible.
A software team doesn't wait six months to determine whether today's deployment improved reliability.
A marketing team doesn't wait until year-end to decide whether a campaign deserves additional investment.
Early signals allow businesses to learn faster than outcomes alone would permit.
The existence of proxies isn't the problem. They're essential.
The problem begins when organizations forget that's what they are.
The numbers on a dashboard are not reality. They are the organization's best attempt at approximating reality.
Those are two very different things.
When the Proxy Becomes the Goal
The existence of proxy metrics isn't what causes measurement systems to fail.
The failure begins when the proxy quietly becomes the objective.
Imagine a marketing team trying to improve click-through rate.
The original objective is straightforward: attract more qualified buyers. Click-through rate is chosen because it provides an early signal that the message is resonating.
At this stage, the metric is serving its purpose. It is evidence.
Over time, something changes.
Weekly meetings begin with CTR. Campaigns are evaluated by CTR. Targets are set around CTR. Performance reviews reference CTR.
Without anyone explicitly deciding it, the conversation shifts.
The objective is no longer attracting qualified buyers.
The objective becomes increasing click-through rate.
The proxy has replaced the outcome.
Researchers studying management accounting describe this phenomenon as surrogation (Choi, Hecht & Tayler, 2012) -the tendency for managers to lose sight of the underlying objective and begin treating the measure as the objective itself.
Once that happens, improving the metric no longer guarantees improving the business. Sometimes it produces the opposite.
Economist Charles Goodhart observed this pattern while studying monetary policy (Goodhart, 1975). His observation, later popularized as Goodhart's Law, is commonly summarized as:
When a measure becomes a target, it ceases to be a good measure.
Donald Campbell reached a similar conclusion while studying public policy (Campbell, 1979). Campbell's Law states that the more a quantitative indicator is used for decision-making, the more likely it is to be corrupted -and to corrupt the very process it was intended to monitor.
Neither principle argues against measurement.
Both argue against forgetting why the measurement exists.
A metric should remain evidence.
The moment it becomes the objective, it begins changing the behaviour it was originally intended to observe.
That's why organizations can improve dashboards while simultaneously making worse decisions.
What's the Difference Between Reporting and Analytics?
The terms reporting and analytics are often used interchangeably.
Historically, they weren't.
As organizations grew larger and decisions became more complex, researchers recognized that reporting historical information wasn't enough. Managers weren't struggling because they lacked reports. They were struggling because they had to make decisions under uncertainty.
This realization led to the development of Decision Support Systems -shifting focus from presenting information to improving decisions.
That distinction remains useful today.
| Reporting | Analytics | |
|---|---|---|
| Focus | Explains what happened | Improves what happens next |
| Direction | Looks backward | Supports future decisions |
| Purpose | Creates visibility | Reduces uncertainty |
| Output | Presents data | Supports decisions |
| Orientation | Measures activity | Supports action |
Reporting explains what happened.
Analytics helps decide what happens next.
Both are necessary. But confusing them creates an expensive illusion.
Organizations build increasingly sophisticated reporting systems while believing they have improved their decision-making. Often, they have simply improved the presentation of historical information.
A dashboard, no matter how beautifully designed, does not improve a business.
Only better decisions do.
Once you accept that every metric is a proxy, another question follows.
How Do You Decide Which Metrics Actually Matter?
Many organizations begin in the wrong place. They ask: What metrics can we collect? Or: Which KPIs should we track?
These are implementation questions. They assume the metric deserves to exist before asking why it exists.
Across the diagnostic work we've done, one pattern appears repeatedly: organizations rarely struggle because they lack metrics. They struggle because nobody agrees on which decisions those metrics are meant to improve.
A better question is simpler: What decision will this metric improve?
Every metric carries a cost. Someone has to collect it. Someone has to interpret it. Teams discuss it in meetings. Leaders allocate attention to it.
Poor metrics don't simply consume storage space. They consume attention.
And attention is one of the scarcest resources inside any organization.
Before a metric earns a place on a dashboard, it should answer three questions.
1. What decision will this metric improve?
Not "What does this metric measure?" but "What decision becomes easier because this metric exists?"
If nobody makes a different decision after seeing the number, the metric has little operational value.
2. What uncertainty does it reduce?
If website traffic increases, what uncertainty has actually disappeared? If customer satisfaction declines, what new confidence do you have?
If the metric doesn't reduce uncertainty, it is probably reporting activity rather than supporting a decision.
3. What would we do differently if this number changed tomorrow?
Imagine the metric doubled overnight. What decision would change?
Now imagine it disappeared completely. Would anyone behave differently?
If the answer to both is "no," the metric probably doesn't belong on the dashboard. It informs nobody. It influences nothing. It exists because software makes it easy to collect -not because the business genuinely needs it.
These three questions reverse how most organizations design measurement systems.
Instead of beginning with available data and hoping it becomes useful, they begin with an important decision and work backwards.
The metric is no longer the starting point.
The decision is.
How Should You Design a Measurement System?
A useful measurement system is designed backwards.
Not from the data that's available -but from the decision the business needs to make.
The Decision-First Measurement Framework
Every measurement system should be designed in the following order.
Business Outcome → Decision → Uncertainty → Evidence → Measurement → Metrics
Notice where the metric appears. At the very end.
By the time a metric is selected, its purpose should already be clear. It exists because it provides evidence for a specific business decision -not because the software happened to collect it.
Step 1. Start with the business outcome.
What business outcome are we trying to improve?
Not traffic. Not engagement. Not impressions. The actual outcome.
Increasing qualified pipeline. Improving customer retention. Shortening the sales cycle.
Everything else exists to support these outcomes.
Step 2. Identify the decision.
What decision are we struggling to make?
Suppose the goal is increasing qualified pipeline. The decision might be: Should we increase Google Ads spend? Should we invest more in SEO? Should we redesign the website?
This is where many dashboards go wrong. They measure business activity before identifying the decision they exist to support.
Step 3. Identify the uncertainty.
What do we not know that prevents us from deciding?
Perhaps you don't know whether prospects trust your website. Perhaps you don't know whether your campaigns are attracting the wrong audience.
Defining uncertainty is often more valuable than collecting another metric. Until uncertainty is identified, measurement has no direction.
Step 4. Decide what evidence would reduce that uncertainty.
What would make us more confident?
Evidence is broader than numbers. Sometimes it's conversion data. Sometimes it's customer interviews. Sometimes it's sales call recordings. Sometimes it's a controlled experiment.
The objective isn't to collect metrics. The objective is to gather enough evidence to make a better decision.
Step 5. Choose the smallest set of metrics that supports the decision.
What is the minimum measurement required?
At this point, the metric already has a purpose. It exists because it reduces uncertainty surrounding an important decision -not because it's available.
This distinction changes how dashboards evolve. Instead of becoming collections of interesting numbers, they become collections of evidence.
Every metric earns its place.
Every dashboard supports a conversation.
Every report exists to improve a future decision.
Why This Framework Works
Traditional measurement systems grow from the bottom up. They begin with available data and gradually accumulate more metrics over time.
Decision-first measurement systems grow from the top down. They begin with a business outcome. Everything else is selected deliberately.
That difference determines whether analytics becomes a reporting exercise -or a decision system.
Can Analytics Replace Human Judgment?
The answer is no.
And it was never supposed to.
Better measurement doesn't eliminate judgment. It improves it.
A dashboard can tell you that customer acquisition cost increased by 18%. It cannot tell you whether that increase is acceptable.
A dashboard can tell you that conversion rate declined after launching a new website. It cannot tell you whether the cause was pricing, positioning, messaging, or market conditions.
A dashboard can tell you that organic traffic doubled. It cannot tell you whether those additional visitors are the people your business actually wants to attract.
Data rarely speaks for itself.
People speak for the data.
Measurement should be viewed as evidence -not answers. Evidence narrows the range of possible explanations. It doesn't eliminate them.
The strongest organizations understand this. They don't separate analytics from decision-making. They integrate the two.
Measurement provides evidence.
Judgment provides interpretation.
Together, they reduce uncertainty enough to act.
Neither is sufficient on its own.
How Measurement Systems Shape Behaviour
At this point, it's tempting to believe that better businesses simply measure more.
The evidence suggests otherwise.
Better businesses measure with greater intent.
Every metric competes for something more valuable than storage space. It competes for attention.
Attention shapes conversations. Conversations shape decisions. Decisions shape outcomes.
Every additional metric influences what gets discussed in leadership meetings. Every dashboard influences what teams optimize. Every report shapes how success is defined.
Measurement systems don't merely describe an organization. Over time, they shape it.
The metrics an organization tracks determine:
- What behaviours get rewarded
- What problems become visible
- What trade-offs become possible to discuss
- What failures get hidden
A measurement system that rewards short-term metrics will produce short-term thinking.
A measurement system that makes gaming invisible will produce gaming.
A measurement system that ignores system health will allow systems to deteriorate.
That's why designing a measurement system deserves the same level of thought as designing a product, building a sales process, or allocating capital.
Poor measurement systems don't simply produce bad dashboards.
They produce poor decisions.
Conclusion
Before you add another metric to a dashboard, ask one question:
What decision becomes easier because this metric exists?
If no one can answer, the metric doesn't belong there.
The purpose of analytics has never been to collect more information. Nor was it to produce more sophisticated reports.
Its purpose has always been to improve decisions.
That was the motivation behind Decision Support Systems more than fifty years ago. It remains the purpose of analytics today.
The organizations that consistently outperform others aren't necessarily those with the largest dashboards. They're the ones whose measurement systems are deliberately connected to how decisions are made.
They don't measure for visibility alone.
They measure to reduce uncertainty.
They measure to learn.
Most importantly -they measure to act.
Because the purpose of analytics isn't to explain yesterday.
It's to improve the next decision.
Frequently Asked Questions
- Why do my dashboards show activity but revenue stays flat?
- Because most dashboards measure activity, not outcomes. Analytics exists to reduce uncertainty so better decisions can be made — but if your metrics track clicks and impressions instead of pipeline and revenue, you're watching the wrong screen.
- Why do I have so many reports but still can't decide what to do?
- Reporting focuses on presenting historical information. Analytics focuses on using evidence to improve future decisions. If your reports tell you what happened but not what to do next, you have a reporting system — not an analytics system.
- Why do good metrics sometimes lead to bad decisions?
- Most business metrics are proxies — measurable signals that stand in for outcomes you can't measure directly, like trust or buying intent. When you optimise the proxy instead of the outcome it represents, the metric improves while the business doesn't.
- Why did optimising for my KPIs make things worse?
- This is called surrogation — when organisations optimise the metric itself rather than the business outcome it was meant to represent. It happens gradually. The KPI goes up, everyone celebrates, and nobody notices the actual goal drifting further away.
- How do I know if I'm measuring the right things?
- Start with the decision you need to make, not the data you have. Identify the uncertainty preventing that decision, determine what evidence would reduce it, and only then select metrics. If a metric doesn't help you decide, it's noise.
- Why can't I just let the data tell me what to do?
- Data doesn't speak for itself. Analytics improves the quality of judgment by providing evidence — but judgment is still required to interpret that evidence and decide what to do. Anyone promising the data will decide for you is selling you a dashboard, not a decision.
- How do I set up measurement that actually helps me decide?
- Use a decision-first framework: start with the business outcome, identify the decision that affects it, surface the uncertainty blocking that decision, determine what evidence would resolve it, then design measurement to produce that evidence. Most businesses do this backwards — they start with available data and hope insight emerges.
References
- (1947). Administrative Behavior
- (1971). A Framework for Management Information Systems
- (1975). Problems of Monetary Management: The U.K. Experience
- (1979). Assessing the Impact of Planned Social Change
- (1992). The Balanced Scorecard -Measures That Drive Performance
- (2006). Competing on Analytics
- (2012). Lost in Translation: The Effects of Incentive Compensation on Strategy Surrogation
- (2018). The Tyranny of Metrics